![]()
|
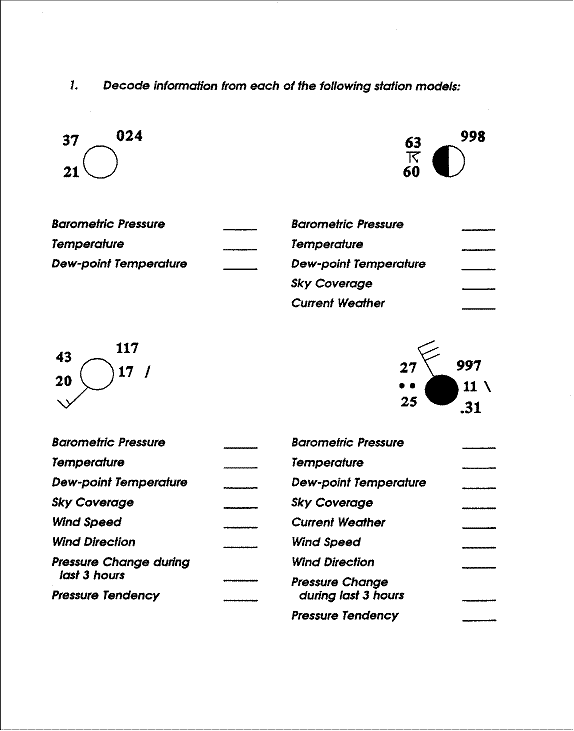
For a printer friendly version of this lab, click here. Background: The purpose of this lab is to illustrate the construction and use of weather maps and to help you identify air masses, fronts, and mid-latitude cyclones on weather maps. Every six hours atmospheric data are collected at approximately 10,000 surface weather stations (including our own weather station here at Barnes.) This data is transmitted to the Meteorological Center located in Washington, D.C. Weather data is then disseminated to national meteorological centers where synoptic-scale (specific time) maps are generated. Being that each weather station collects data for as many as eighteen weather characteristics, a method of symbolization must be used to include all this information on a single weather map. The station model developed by the World Meteorological Organization is the standard format for symbolizing weather characteristics. The following figure illustrates the arrangement of data in the WMO model.
A table of the symbols used in the WMO model is listed below:
1. Using the table and the weather station model above, complete the following:
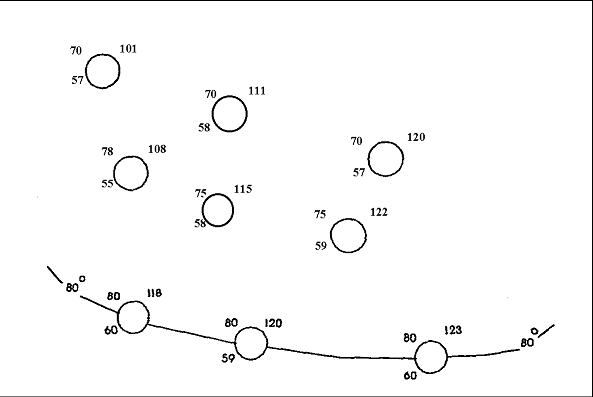
Weather maps become most useful when their information is analyzed in some fashion. One means of analysis is to highlight the patterns of specific variables. This can be done by consulting isolines (lines of constant value). In the figure below, an isotherm (line of constant temperature) is constructed through 80°F.
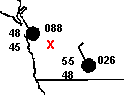
2. Complete the analysis in the figure above by constructing isotherms at 70°F and at 75°F. Obviously drawing lines in this example is straightforward since the temperature at each station was exactly 80°, 75°, or 70° F. Since such patterns rarely occur in nature it is often necessary to estimate between points. For example: if you wanted to draw a 50° isotherm, you need to locate a number of places on the chart at 50°. It is unlikely that many stations will report exactly 50°, so you will need to do some estimating. To estimate these points, you would find pairs of adjacent stations close to 50°: one station above 50° and the other below 50°. Looking at the chart below, we find the upper station is at 48° and the lower one at 55°. Mark the location where you estimate it to be 50° with an "X". In this example, you would place the "X" closer to the station at 48°, since it is closer to 50° than the station at 55°.
If a station reports exactly 50°, then place the "X" at the station. Continue this process for all stations reporting near 50°. Finally, you would connect the "X's" with a smooth, curved line to complete the 50° isotherm. 3. On the following weather map, draw isotherms at 45°, 55° and 65° F.
Based on your knowledge of isotherms, answer the following questions: 4. What is an isotherm? 5. Briefly describe how you determine the points used to construct an isotherm. An air mass is a large body of air with relatively uniform temperature and humidity characteristics. Air masses form over large land or water surfaces and take on the temperature and moisture characteristics of these surfaces where they remain stationary for days, or even weeks. Their temperature characteristics are classified as maritime or continental. The following types of air masses result:
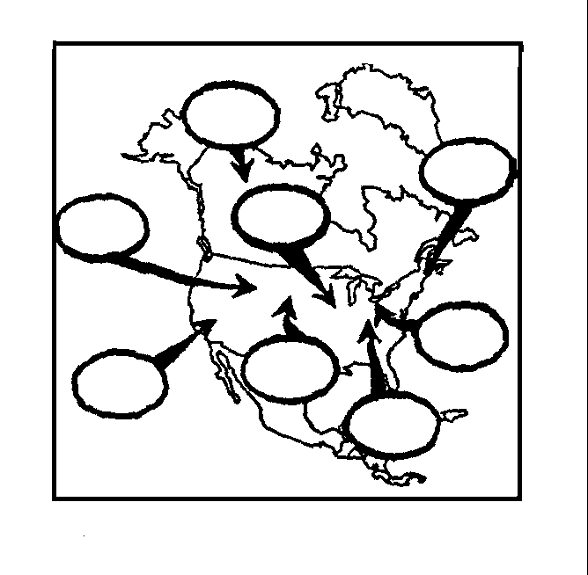
Note: Continental equatorial and Maritime arctic air masses are rarely found. Air masses often migrate from their source regions and affect mid-latitude weather. Examine the diagram below showing air masses affecting North America. 6. Based on the source regions shown by the ovals, use the appropriate two-letter code to indicate each air mass type.
The boundary between two unlike air masses is called a front and can be identified by any of the following characteristics:
7. Draw the frontal boundary in the figure below:
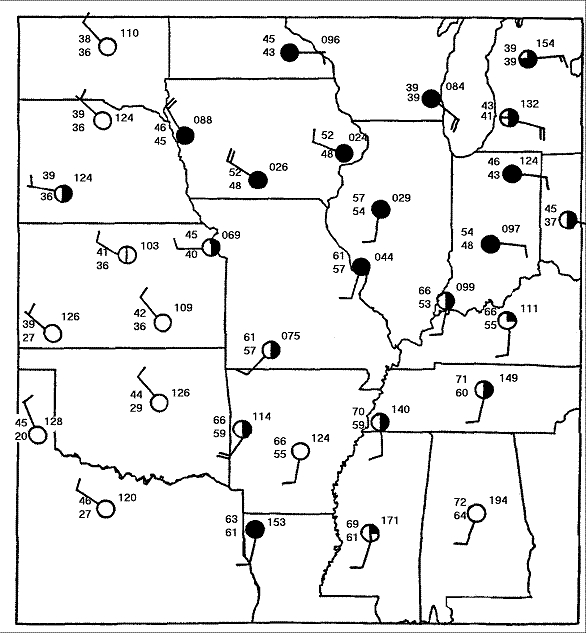
In this exercise, you will be drawing isobars on a weather chart. Isobars are lines that connect places at the same pressure. Obviously, as in isotherms, such patterns rarely occur in nature. Hence, it is often necessary to interpolate between points. For example, we may want to draw a 1012mb isobar (line of constant barometric pressure) using the following station data:
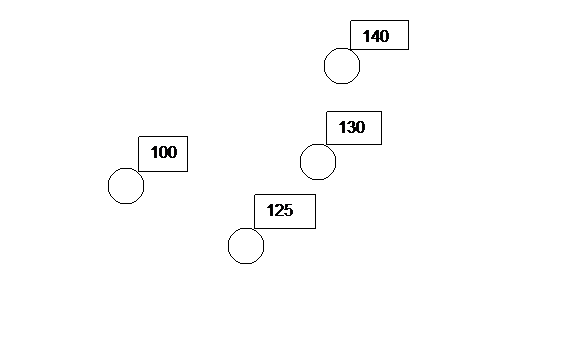
To interpret the data for barometric pressure, you first need to change the data to a more meaningful number. First, place a decimal point before the final number. For example, 125 would become 12.5. Then if the first two numbers are less than 50, place a 10 in front of the numbers; otherwise place a 9 in front. In our example, 12.5, the first two numbers are 12, which is less than 50. We then place a 10 in front, and the barometric pressure is actually 1012.5 millibars. In a simple interpolation scheme we might decide that 1012 Mb is exactly between 1010.0 and 1014.0 Mb and would indicate this position with a small “x.” A value of 1012 Mb would also exist two-thirds the distance between 1010.0 and 1013.0 Mb, and four-fifths the distance between 1010.0 and 1012.5 Mb.
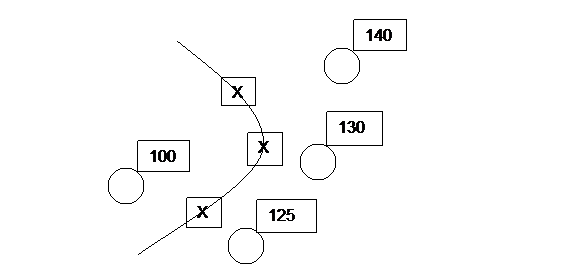
The “X’s” we draw represent new data points through which we can make a 1012 Mb isobar. 8. Using the map below: a. Draw isobars at 1004 mb, 1008 mb, 1012 mb b. Label the low pressure center with an “L”
Answer the following questions based on the completed chart above:
9. What is an isobar? 10. What is the barometric pressure at Milwaukee, WI? 11. Roughly, where is the center of "low pressure" located?
< Lab Notes > |