|
Topographic Maps Note: Remember you are responsible for graphs, charts and other items that form part of the overall summary of this topic. Vocabulary:
Background: Historically, the development of highly accurate, detailed topographic maps has largely been driven by military requirements. A unique characteristic that distinguishes topographical maps from other kinds of maps is the fact that they show the topography or shape of the land in addition to other features such as roads, rivers, lakes, etc. Because topographical maps show the shape of the land, they are the most suitable type of map for most outdoor activities that take place in areas that are not heavily populated. Hence, in order to study landscape features, we use a topographic map. The key to using topographic maps is understanding contour lines. Each contour line connects places that have the same elevation or height. In order to understand completely the usage of topography, you need to be familiar with compass directions and map reading. Be sure to have these notes handy as you complete your lab report. Materials:
Procedure:
Map Activity A
Questions: 1. What is the exact elevation of the following points? a. point A = _____ meters b. point E = _____ meters 2. What is the approximate elevation of the following points? a. point C = _____ meters b. point F = _____ meters 3. Explain why you can determine the exact elevation for points A and E but only approximate elevations for points C and F. 4. How many hills are shown on the map? 5. In which direction is the Ert River flowing? 6. Which of the following points have the same elevation? a. points A & B b. points E & A c. points C & D d. points F & C 7. Draw an island approximately 1.5 km long and 1.0 km wide. Draw it in Molen Lake so that its longest dimension runs approximately north-south. 8. Add a mountain with elevation between 120 to 130 meters to the northern end of the island. Draw a lake on top of the mountain with a river flowing out of it in an easterly direction. 9. Add another mountain that has a depression on its top that is between 10 and 20 meters deep on the southern end of the island. 10. Label all contour lines on the island in meters. Map Activity B
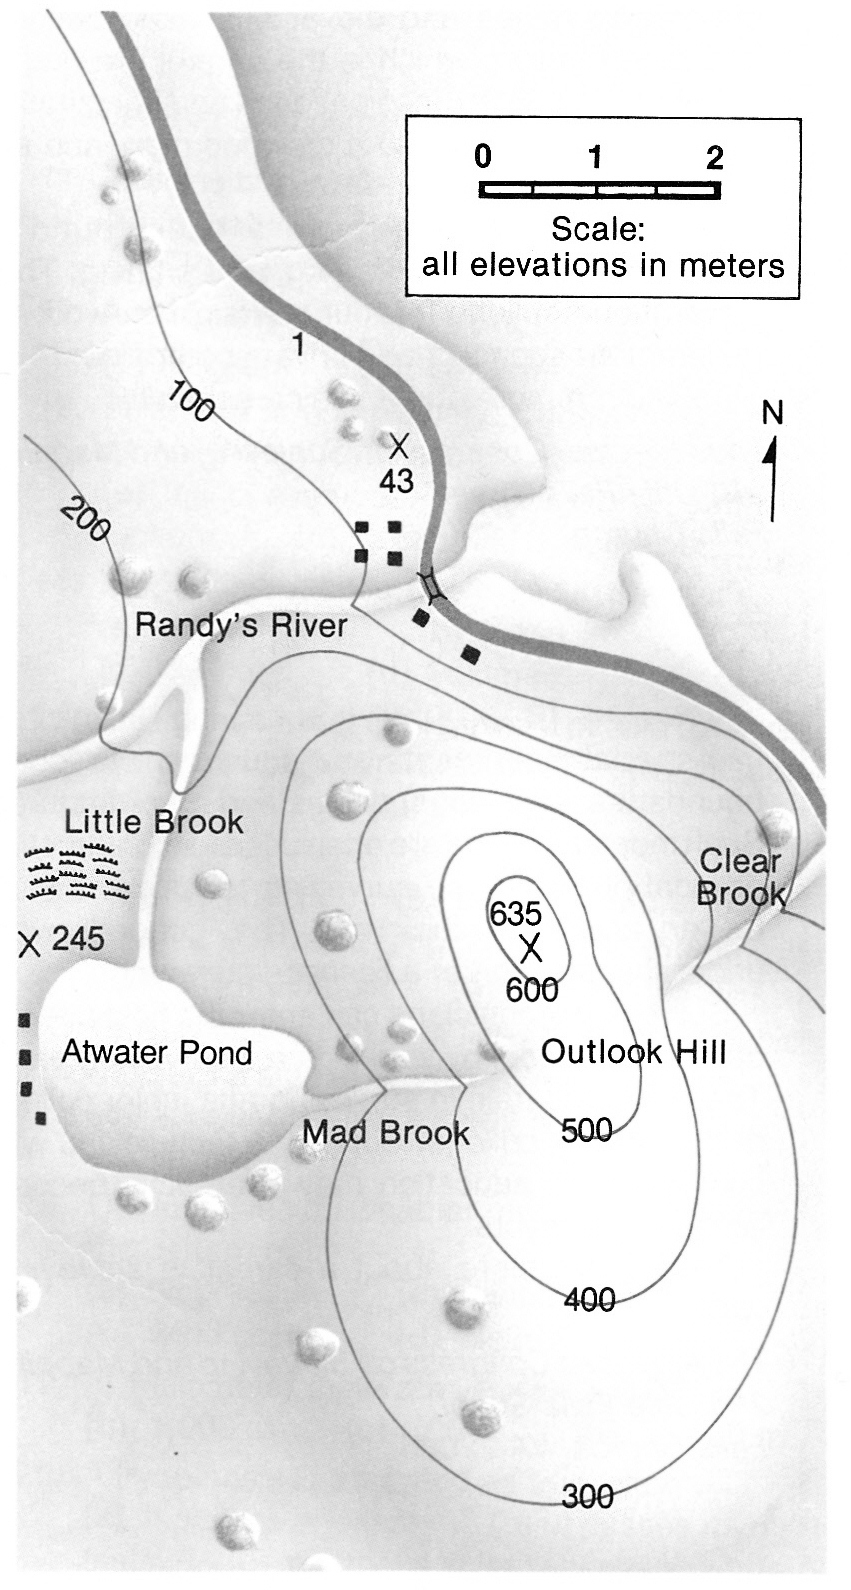
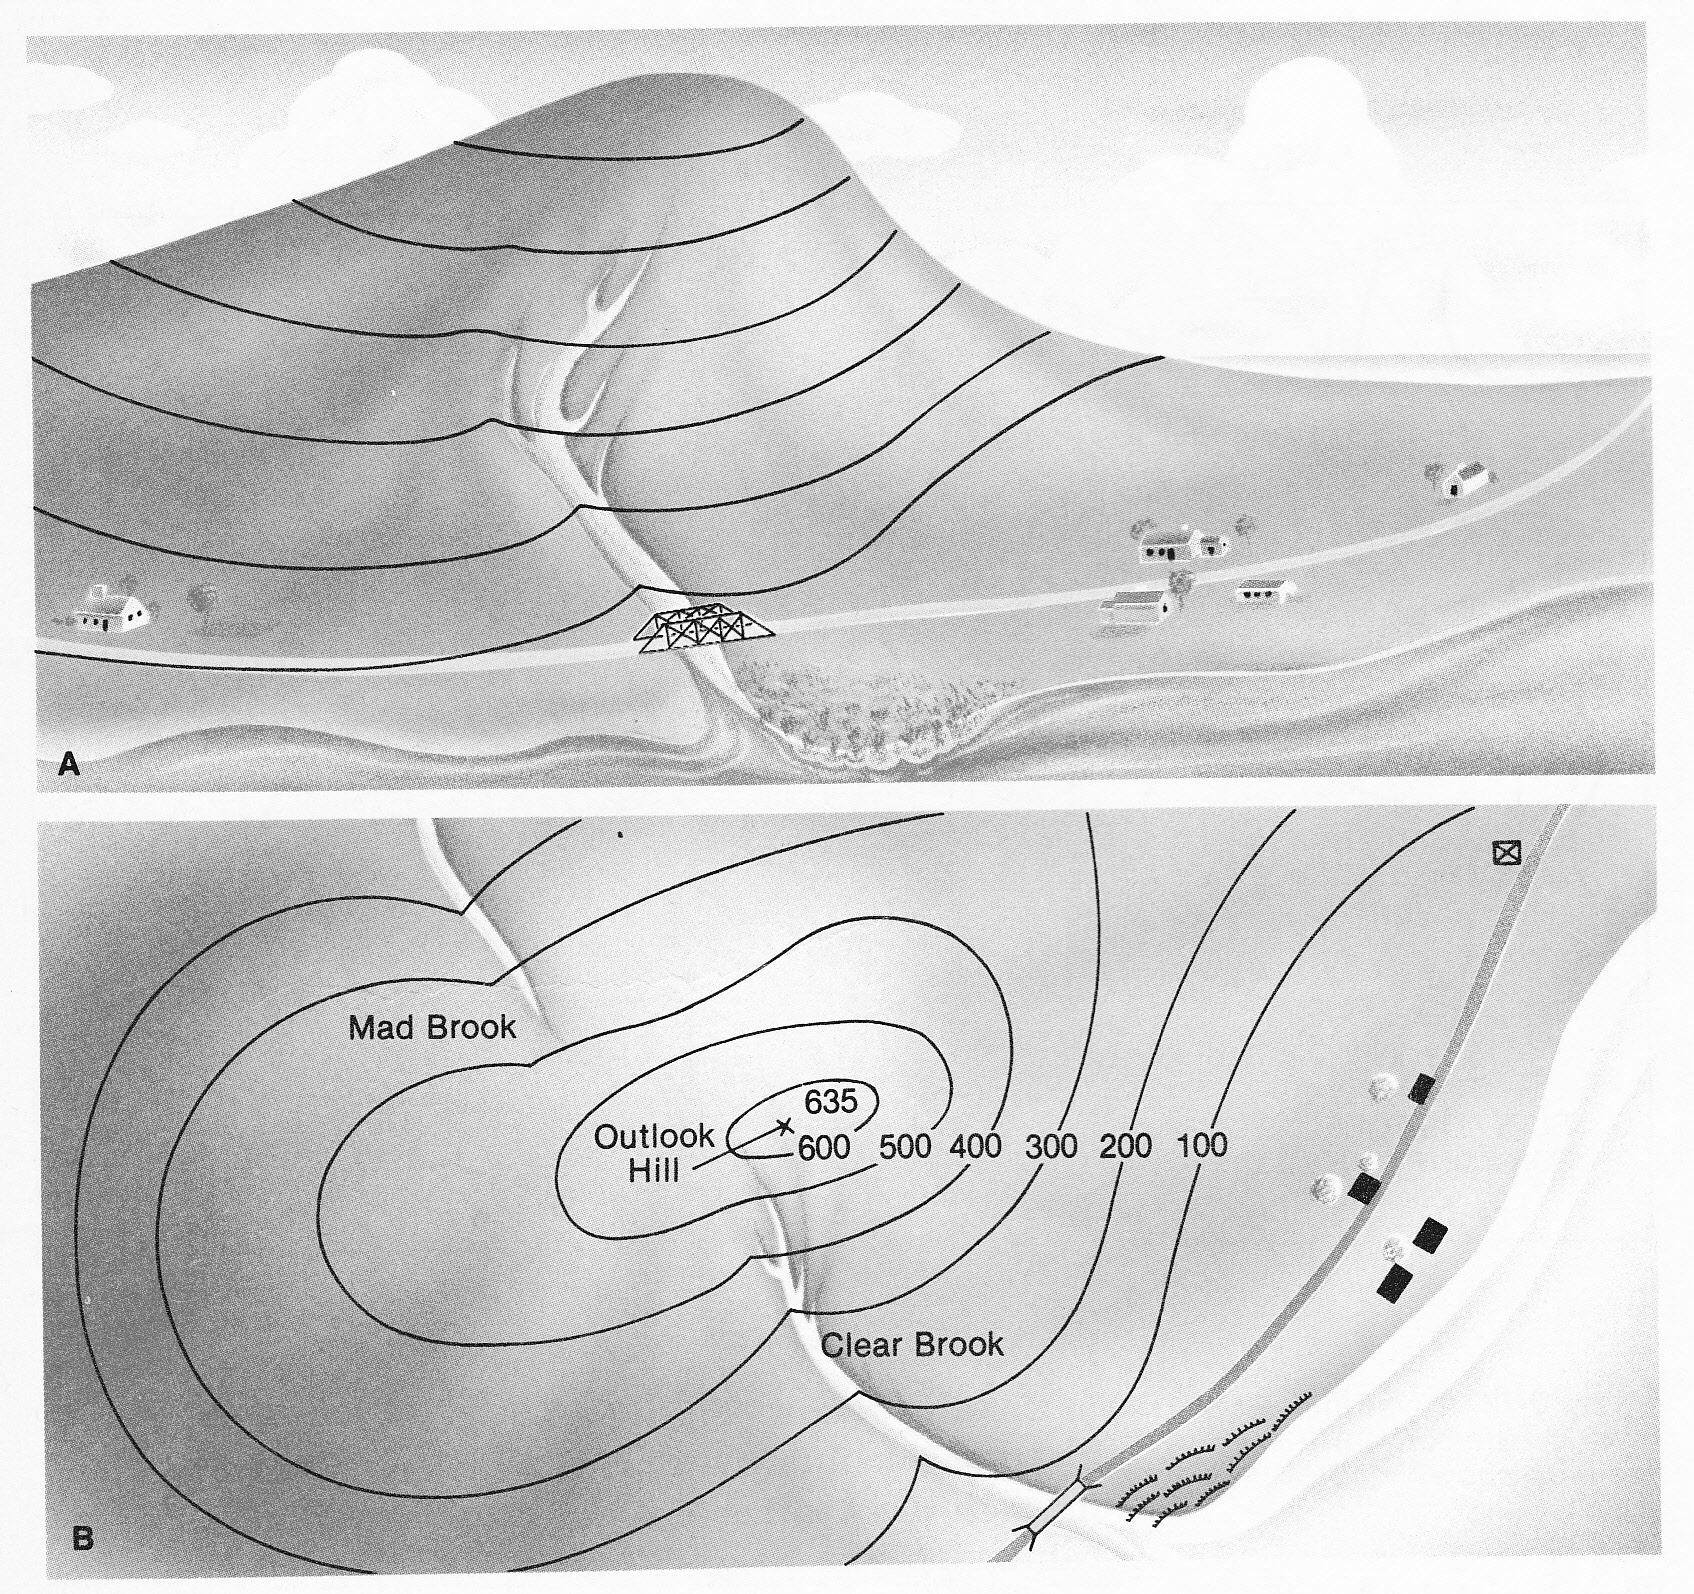
Questions: 1. What is the highest elevation on the map? What is the lowest elevation? 2. How many bench marks are there on the map? What elevations do they mark? 3. What is the contour interval? 4. What is the highest contour line? 5. Why are the contour lines closer together on one side of Outlook Hill? 6. In what directions do you find steep slopes on the map? 7. Imagine you are traveling south on Route 1. Describe the landscape and its changes as you travel along. 8. Study the brooks and rivers. In which direction are each flowing? 9. Find Outlook Hill. Which is its steepest side? Draw a side view of the hill as seen from Clear Brook. 10. Describe the scenery you would see if you traveled around Atwater Pond in a boat. 11. Which stream flows into Atwater Pond? Which stream flows out of Atwater Pond? How can you tell? 12. How many buildings are shown on the map? 13. Where is the swamp located? Be sure to state direction in regards to location of swamp relative to nearby terrain. 14. What is the length of Route 1 on this map? 15. How far is it from the buildings on Route 1 to Atwater Pond? In what direction would one walk to get there? When doing the lab report write-up, be sure to follow the guidelines. |